| Spring, 2006, Diagnoses
of Turfgrass Winter Injury/Kill
by
Dr. James McAfee, Dr. David Chalmers, Mr. Roger Havlak
Department of Soil and Crop Science
Texas A&M University
Winter kill is a general term used to describe the loss of turfgrass
plants during winter months. Loss of turfgrass plants during winter
months can be caused by factors such as: low temperature kill
(freeze damage), desiccation (drying out of plant material), disease
activity and insect damage such as grubs. In most years, desiccation
is the number one reason for loss of turfgrass in home lawns,
commercial properties, sports fields and golf courses. With the
extensive drought conditions throughout Texas in 2005, including
winter months, loss of turfgrass from desiccation is potentially
going to be a major problem. Individuals who did not water their
turfgrass plants during the 2005-2006 winter months could experience
loss of plant material. Grasses such as St. Augustinegrass and
Centipedegrass are especially susceptible to winter kill from
desiccation during winter months. We have already observed numerous
St. Augustine grass lawns in the area that have loss some grass.
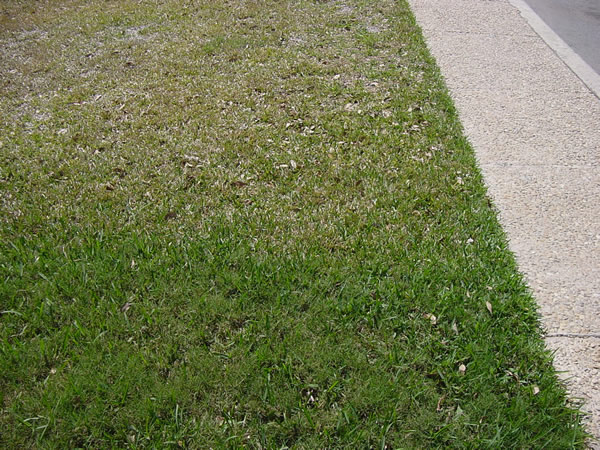
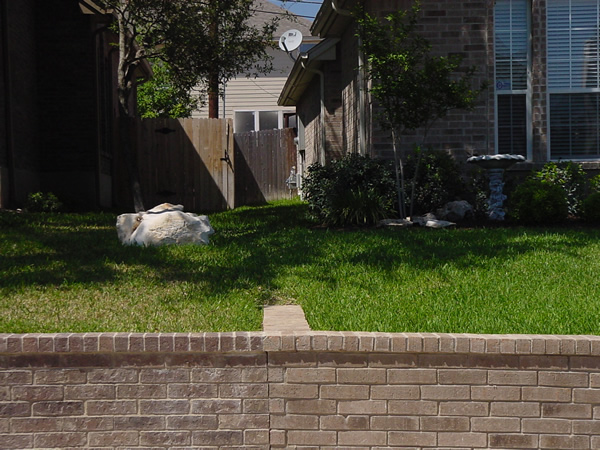
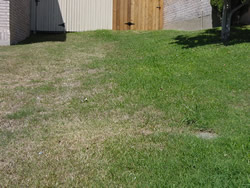
Camino Ridge in Hills of Sonterra #1. |
Camino Ridge in Hills of Sonterra #1a. |
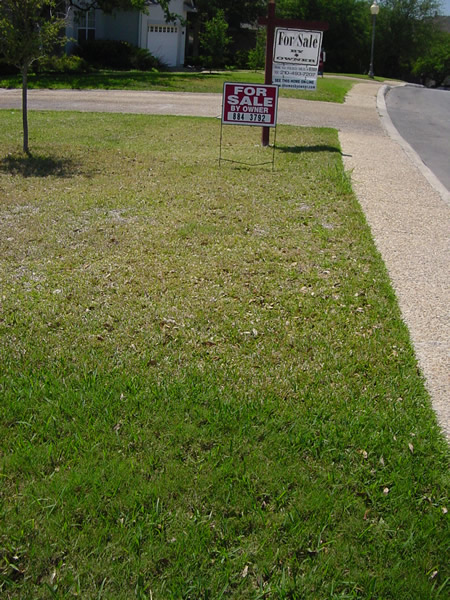
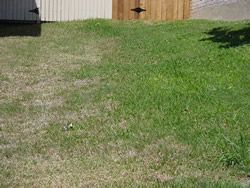
Camino Ridge in Hills of Sonterra #2. |
Camino Ridge in Hills of Sonterra #2a. |
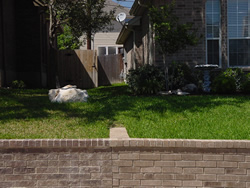
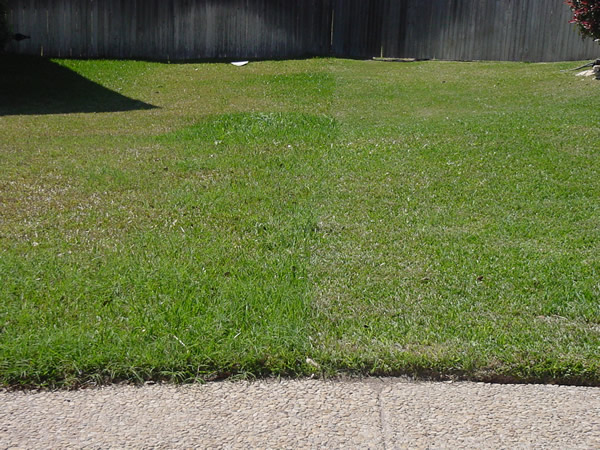
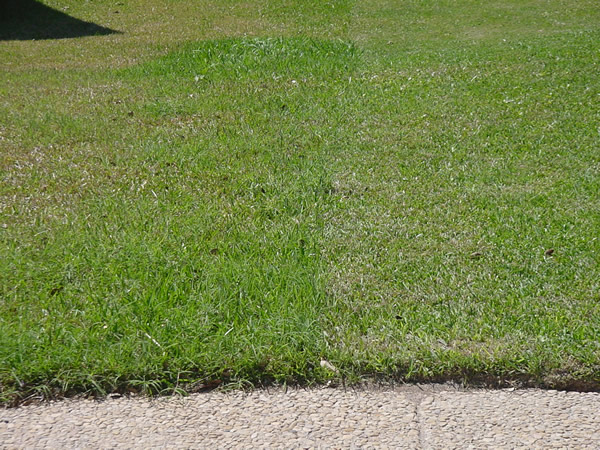
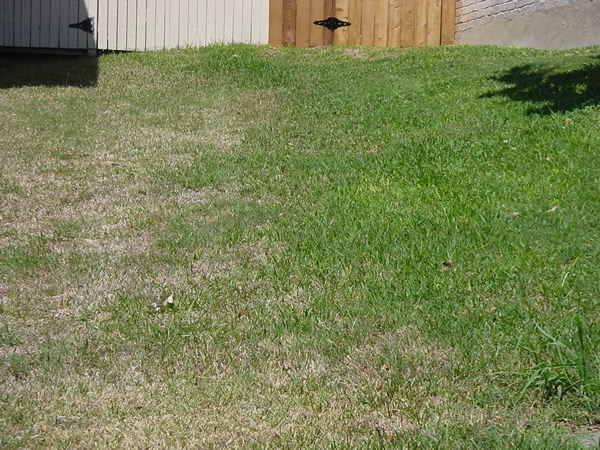
Bosque Vista in Hills of Sonterra. |
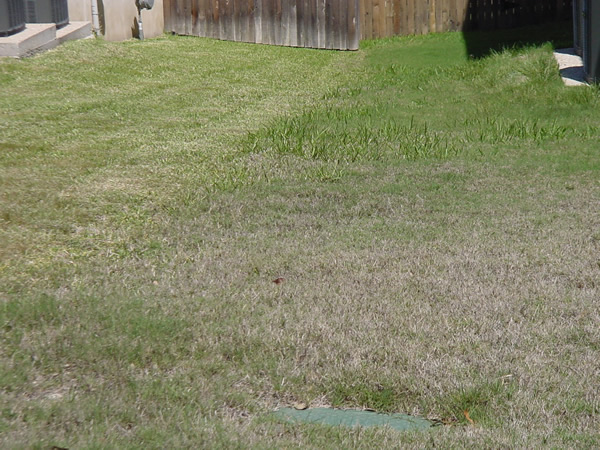
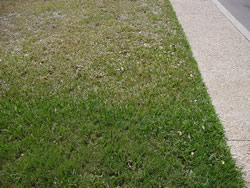
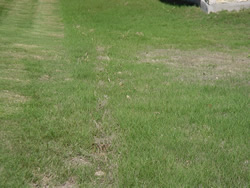
Watered on right--drought killed on left |
Notice where water created green washes of grass into the
drought damaged grass to the left |

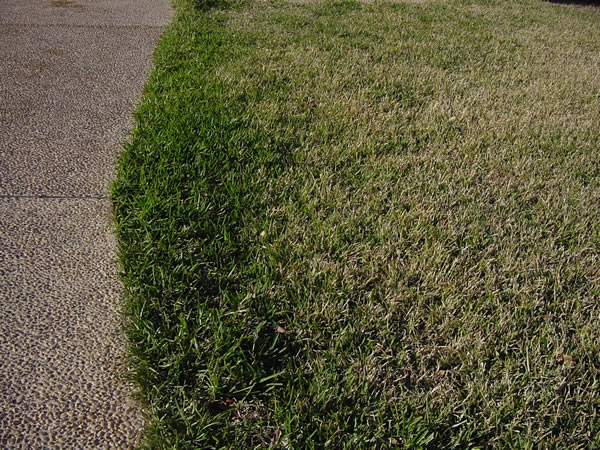
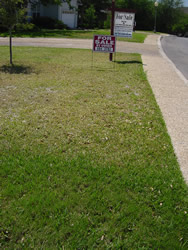
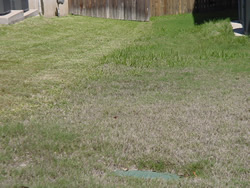
The only St. Augustinegrass alive in this yard on Bosque
Vista received runoff water from the driveway. |
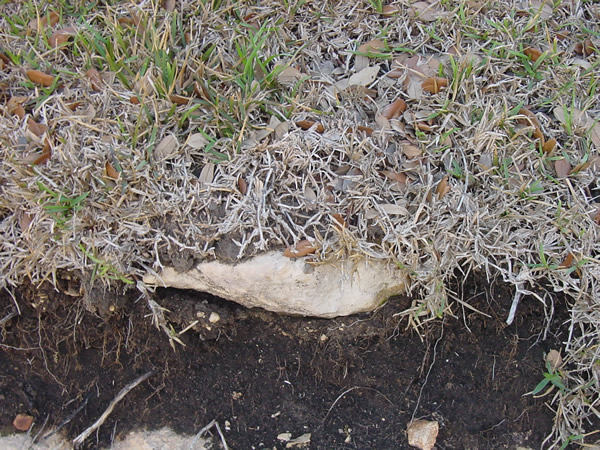
Shallow soil on the top of rocks caused this grass to kill
during the drought. |
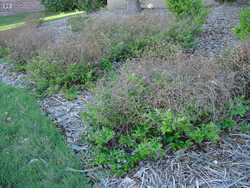
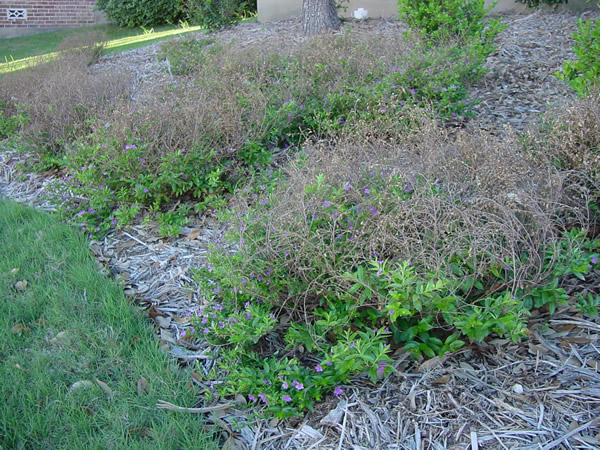
These shrubs were killed by cold and not drought--Notice
the green well-watered Bermuda. |
While it is a little early to tell how extensive the damage will
be, there will be a significant loss of St. Augustinegrass in
lawns that were not watered during the past winter months. While
St. Augustinegrass and Centipedegrass are hardest hit by the dry
conditions, turfgrasses such as bermudagrass and zoysiagrass will
also be lost, especially if they were not watered at all in late
summer and winter months.
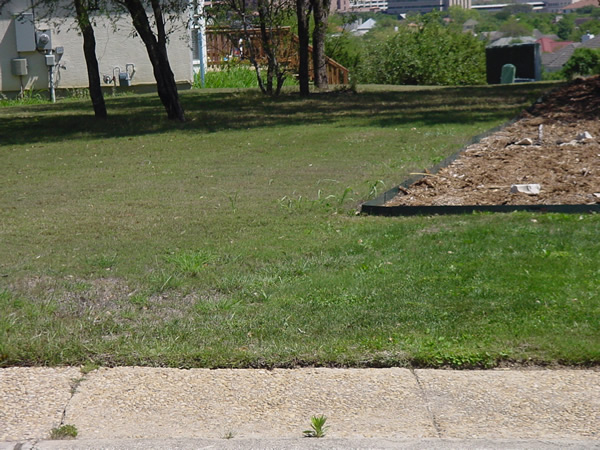
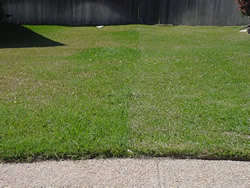
Tifway bermuda on right damaged by drought on Bosque Vista
in Hills of Sonterra. |
Tifway bermuda on right damaged by drought. |

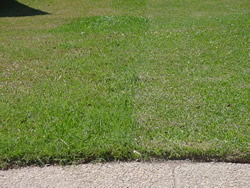
Watered bermuda on right is green compared to drought-stressed
bermuda on left on Gran Roble |
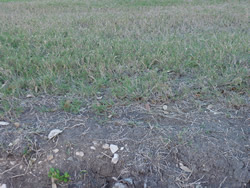
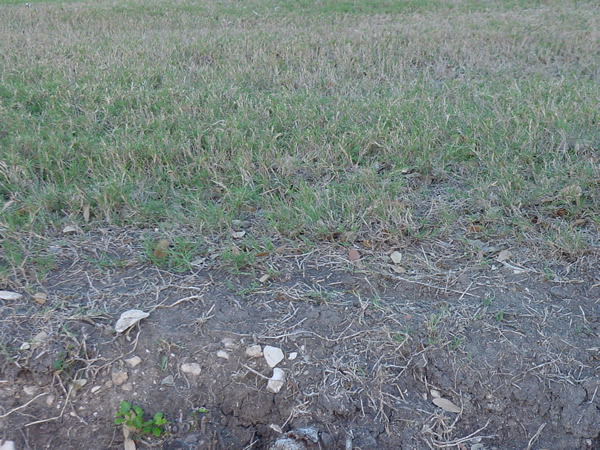
Even Bermudagrass could not withstand the drought. |
Trying to diagnose what killed the turfgrass plant during the
dormant winter period can sometimes be difficult. Listed below
are symptoms to look for when trying to determine the actual cause
for loss of turfgrass areas in the winter months.
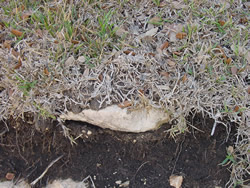
A. Low temperature/desiccation:
The symptoms for both of these causes are very similar and it
is often impossible to determine which one actually killed the
grass. In some situations, loss of grass can be attributed to
both dry soil conditions and low temperature injury. With both
of these factors, the entire turfgrass plant will be a brown to
tan color, eventually turning a gray color in late winter to early
spring. Even though the root system is dead, the turfgrass plant
will still be firmly attached to the ground. In comparison, if
the loss is due to grub injury, the dead grass can be easily lifted
from the soil because all the roots have been chewed off by the
grubs.
=====================================
B. Grub damage:
The white grub, larval stage of the May/June beetle will feed
on the turfgrass plants in late summer to early fall months, thus
destroying the root system of the grass plants. Without any root
system, the grass plant cannot take up the necessary nutrients
and water required for survival. Again, the easy way to distinguish
between grub damage from environmental damage is to pull on the
turfgrass plants and if the grass pulls up very easily, then the
damage is likely to have been caused by grubs feeding on the root
system the previous summer and fall months. Also, in late winter
to early spring months you should be able to find the white C-shaped
larvae in the soil below the damaged turfgrass. Generally, it
takes at least 4 to 5 grubs per square foot to cause loss of turfgrass.
=====================================
C. Diseases:
There are two main disease problems that can cause serious damage
and/or loss of turfgrass plants in the winter months. These are
brown patch and Take-All Root Rot (TARR). While brown patch will
attack all major turfgrass plants, it is primarily a problem on
St. Augustinegrass, Centipedegrass and zoysiagrass in the fall
months when night time temperatures drop below 70° F and excess
water is available. Usually, the brown patch fungus does not kill
the plants, but will kill all the leaf blades in the affected
areas, thus weakening the plants and making them more susceptible
to low temperature injury. Also, affected sites in the lawn will
be slower to green up in the following spring and may appear to
be dead areas as the lawn starts to green up. The easiest method
to identify old brown patch injury is to pull on the leaf blades
in the affected area and if they pull away from the stolons without
any resistance, then the damage was caused by brown patch. Also,
if brown patch is the only problem, then the stolons and roots
will still be white to light green in color.
Take-All Root Rot is caused by a soil borne fungi that attacks
the root system of the plant in the fall and spring months when
soil temperatures are in the 60 to 65 degree F. range. This fungus
has also been shown to attack all turfgrasses, but has primarily
been a major problem on St. Augustinegrass. Symptoms of TARR in
the spring include thin, yellow stands of St. Augustinegrass to
large patches of totally dead grass. Due to the drought conditions
in the fall and winter months in 2005 - 2006, there is probably
going to be a lot of TARR problems showing up in lawns this spring.
TARR and brown patch are often confused with each other and in
some cases it is possible that both diseases were active in the
lawn. Outlined below is a chart to help distinguish the difference
in damage from TARR and brown patch.
Plant part TARR Brown patch
------------- --------------------- --------------------
Leaves brown, firmly attached brown, easily pulled from stolons
Stolons brown white to light green
Roots short, dark brown to black* white
---------------------------------------------------------------------------------
* The short, dark brown to black roots is a very key characteristic
for identifying TARR activity. In some cases, due to the extensively
damaged root system, the St. Augustinegrass can be pulled up similar
to grub damage. However, with grub damage, the roots have been
completely chewed off the plant, while with TARR you will still
find the short, dark brown to black roots on the stolons.
==========================================
Turfgrass Best Management in Drought:
For most areas of the state, 2005 was one of the driest years
on record. Even though some areas of the state recently have received
some welcome rainfalls, forecasts are still for this drought condition
to continue, at least until sometime in the summer months. Many
cities and towns are already talking about going to phase III
water restrictions shortly and possibly phase IV restriction within
the next couple of months if adequate rainfall does not occur.
Phase IV restrictions generally means no outdoor use of water.
While there is not a lot homeowners can do to save their lawn
if water becomes unavailable for use on landscapes, proper lawn
management this spring until phase IV restrictions are put in
place will have a major impact on how long the lawn can survive
drought conditions. Listed below are some best management practices
for managing turfgrasses in a law during drought conditions.
========================================
A. Fertilization:
As long as water is available, apply the recommended rate of
nitrogen for the turfgrass site. Do not apply excess nitrogen
and create excess top growth in the turfgrass plants during the
spring months. Creating excess top growth will affect the plants
ability to develop a deep, extensive root system. For most turfgrasses,
apply 0.5 to 1.0 pound of actual nitrogen per 1, 000 square feet
in the spring months. If lawn irrigation is severely restricted
or completely turned off, then discontinue applying any more fertilizer,
especially nitrogen, to the lawn. Potassium is a key nutrient
in stress tolerance for turfgrass plants, including drought tolerance.
=======================================
B. Mowing:
As long as the turfgrass plant is growing, then continue to mow.
Make sure the lawn is mowed often enough to never remove more
than 30 to 40% of the leaf blade. Removing excess leaf area will
stress the turfgrass plants and thus make them less tolerant of
drought conditions. If the grass stops growing due to drought
conditions, then discontinue mowing the grass.
Slightly raising the mowing height will help reduce some stress
on the turfgrass plants. However, raising the mowing height doesn't
mean the turfgrass plants will use less water as some people believe.
Listed below are recommended mowing heights for the different
turfgrasses in home lawns during drought conditions. =======================================
Grass Height (inches)
--------- -------------------
Common bermudagrass 2 to 2.5
Hybrid bermudagrass 1 to 1.5
St. Augustinegrass (sun) 3 to 3.5
St. Augustinegrass (shade) 3.5 to 4.0
Centipedegrass 1.5 to 2.0
Zoysiagrass (japonicas) 1.5 to 2.0
Buffalograss 2.0 to 3.0
========================================
C. Irrigation:
As long as water is available, continue to water the lawn. However,
it is very important that supplemental water be applied wisely
and not wasted. Applying excess amounts of irrigation water in
the spring will not mean the soil will hold water longer going
into the summer months. In fact, applying excess water to lawns
in the spring will result in a turfgrass plant with a shortened,
week root system going into the hot, dry summer months. Water
the landscape as infrequently and deeply as possible. However,
soil type and soil depth will often dictate how often landscapes
need to be watered. As a general rule, apply 1.0 inch of water
per week in the spring and fall months and 1.5 to 1.75 inches
of water in the heat of summer if adequate rainfall does not occur.
Note, a majority of warm season turfgrasses can survive with less.
Conduct an audit of the irrigation system to make sure it is
working as efficiently as possible and to determine how much water
the system is applying. First part of an audit is to inspect the
irrigation system for any problems that would affect irrigation
uniformity, such as broken sprinkler heads, heads not rotating,
heads not popping up high enough and mis-aligned heads ( heads
not vertical). Fix any problems noted during the inspection. The
second phase of an audit is to determine how fast the water is
being applied (measured in inches per hour) and how uniformly
the water is being applied (measured in percent). Listed below
are the steps for conducting this part of an irrigation audit.
(1) Place 5 to 6 straight edged cans (cat food, tuna, etc.) in
one zone of the irrigation system. Note, the more cans you use,
the more accurate the test.
(2) Turn that zone on and run it for a set period of time, say
30 minutes.
(3) Take a ruler and measure the depth of water in each can and
record it.
(4) Calculate the average depth of water from all of the cans.
(5) Repeat this sequence for all zones.
Example: Five cans were used for zone 1 in the irrigation system.
The amount of water found in the five cans was as follows: 0.5,
0.4, 0.6, 0.4 and 0.6. Add the depths together and then divide
by the number of cans (five).
0.5 + 0.4 + 0.6 + 0.4 + 0.6 = 2.5 inches of water divided by
5 (cans) = 0.5 inches of water in 30 minutes or 1.0 inch of water
per hour. This means zone 1 would need to be run for one hour
each week in the spring and fall and approximately 1.5 to 1.75
hours in the heat of summer to apply the necessary amount of supplemental
irrigation for healthy plant growth.
Do not apply irrigation water to run-off. Runoff wastes water.
If run-off occurs before the required amount of water can be applied,
then turn the irrigation system off and apply the rest of the
water needed later in the week.
To determine the distribution value, compare average of lowest
quarter of catch cans with the average for total catch cans. Listed
below are the steps for calculating distribution uniformity using
the lowest quarter method. Note, need at least 8 catch cans to
obtain a distribution value. The more catch cans you use, the
more accurate the distribution value. It is best to do this procedure
in times of low wind (early morning).
Step 1. List catch can volumes (water depth in inches) from the
smallest to largest depth collected.
Step 2. Calculate the average depth volume (inches) for the lowest
quarter (one-fourth) of the catch cans, cans with the lowest water
levels.
Step 3. Calculate the average volume level (inches) for all
the catch cans.
Step 4. Divide the lower quarter volume average (inches) by the
total water volume level average (inches) and then multiply by
100 to obtain the distribution value.
Formula: DU = 100 x (Vlq ÷ Vavg.)
DU = distribution uniformity.
Vlq = Volume average of lower quarter of total catch cans. Vavg.
= Volume of total catch cans divided by total number of catch
cans.
=======================================
Example: Calculate distribution value for following 8 catch can
volumes:
Catch cans = .2 + .3 + .3 + .4 + .4 + .5 + .6 + .6
A. lowest quarter = .2 + .3 = .5 ÷ 2 = .25
B. total volume = 3.3 ÷ 8 = .41 inch
C. DU = 100 x ( .25 ÷ .41 ) = 61% distribution uniformity
=======================================
======================================= |